Profiling a Flutter app
Today I ran into some performance issue when I used my image gallery app on a folder of 17k images. Lots of jank. So I decided to use the Flutter profiler for the first time.
I started from the Flutter performance profiling page.

They give 3 ways to run the profiler, two of which applied to me:
- in VS Code, modify launch.json to enable profiling.
- Run
flutter run --profile.
I decided to do it in VS Code. However I didn't know how to find that file. It wasn't in the folder of my project, and it wasn't in the IDE's settings page. So I went to VS Code's documentation.

They say you should go to the Run and Debug pane to create the file.
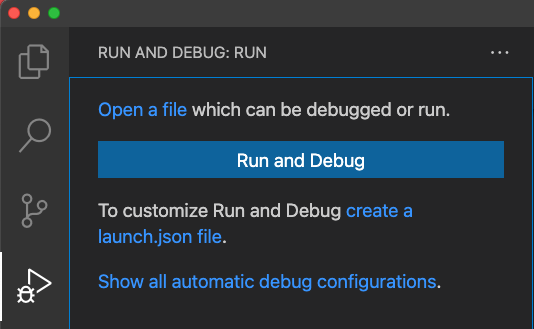
Upon clicking to create the launch.json file, it started installing some libraries:
Installing C# dependencies...
Platform: darwin, arm64

Downloading package '.NET Core Debugger (macOS / x64)' (45875 KB).................... Done!
Validating download...
Integrity Check succeeded.
Installing package '.NET Core Debugger (macOS / x64)'

Downloading package '.NET Core Debugger (macOS / arm64)' (47834 KB).................... Done!
Validating download...
Integrity Check succeeded.
Installing package '.NET Core Debugger (macOS / arm64)'

Downloading package 'Razor Language Server (macOS / x64)' (60206 KB).................... Done!
Installing package 'Razor Language Server (macOS / x64)'

Finished

Failed to spawn 'dotnet --info'
And failed.
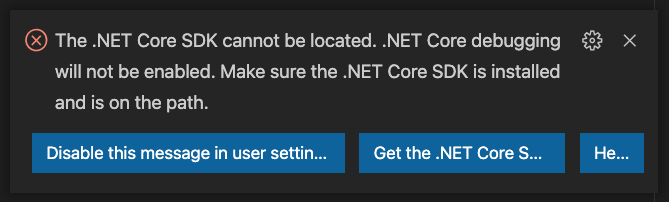
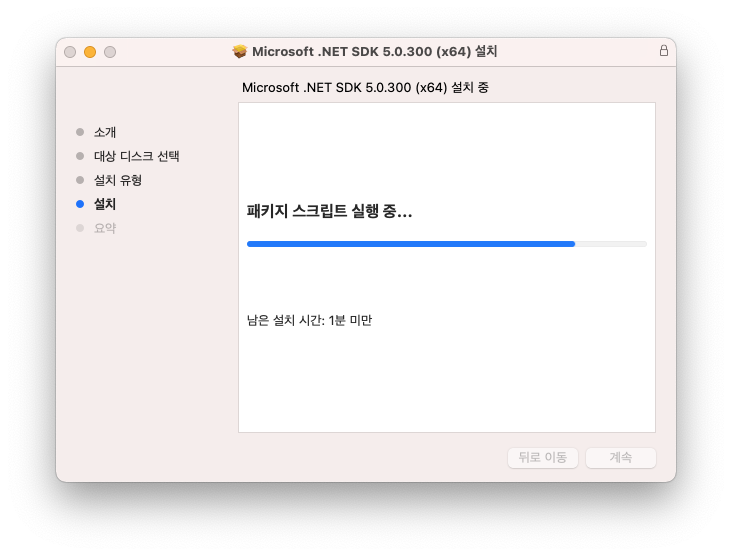
Clicking Get the .NET Core SDK opens a page to download it. It downloads and installs fine.
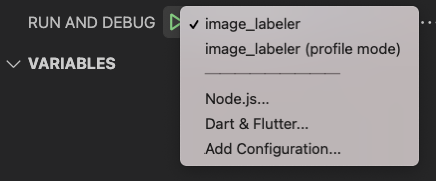
This time clicking the create launch.json worked and created a config with two profiles:
- Launch the app
- Launch the app in profile mode.
The options also show up on the left pane, where I can run them.
It took a few minutes to compile, more than usual. When it finally ran, it didn't show me the DevTools and widget tree as usual:
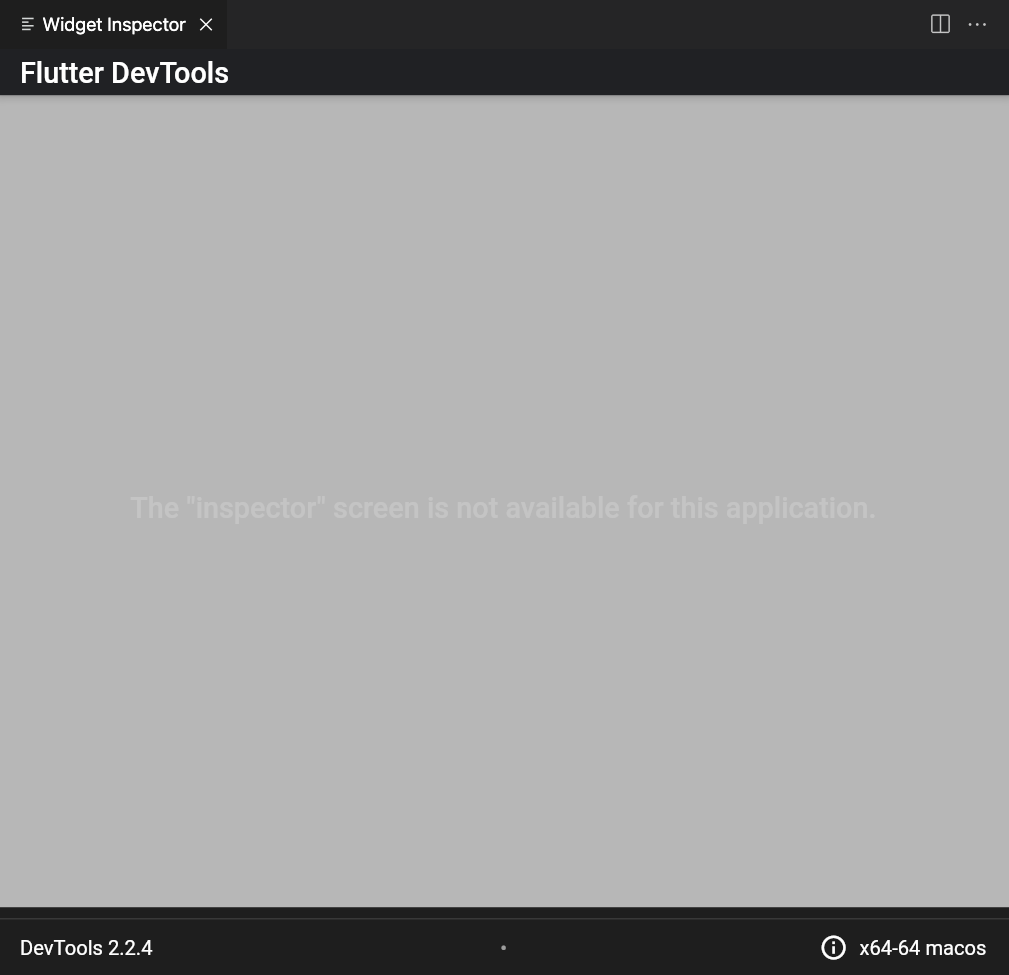
This StackOverflow post says the Inspector doesn't work in profile mode. Yet the Flutter's page on profiling says:
Once your app is running in profile mode, launch DevTools.
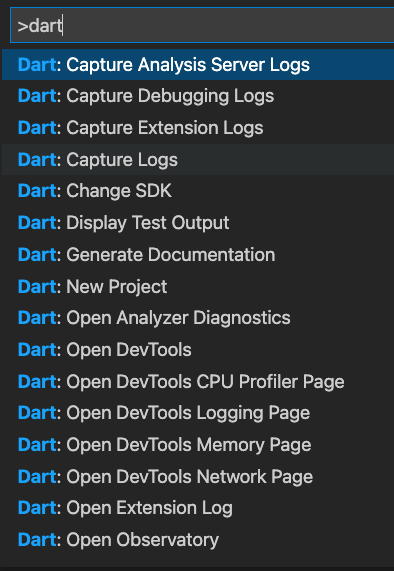
But clicking the new squiggly icon opens a new tab!
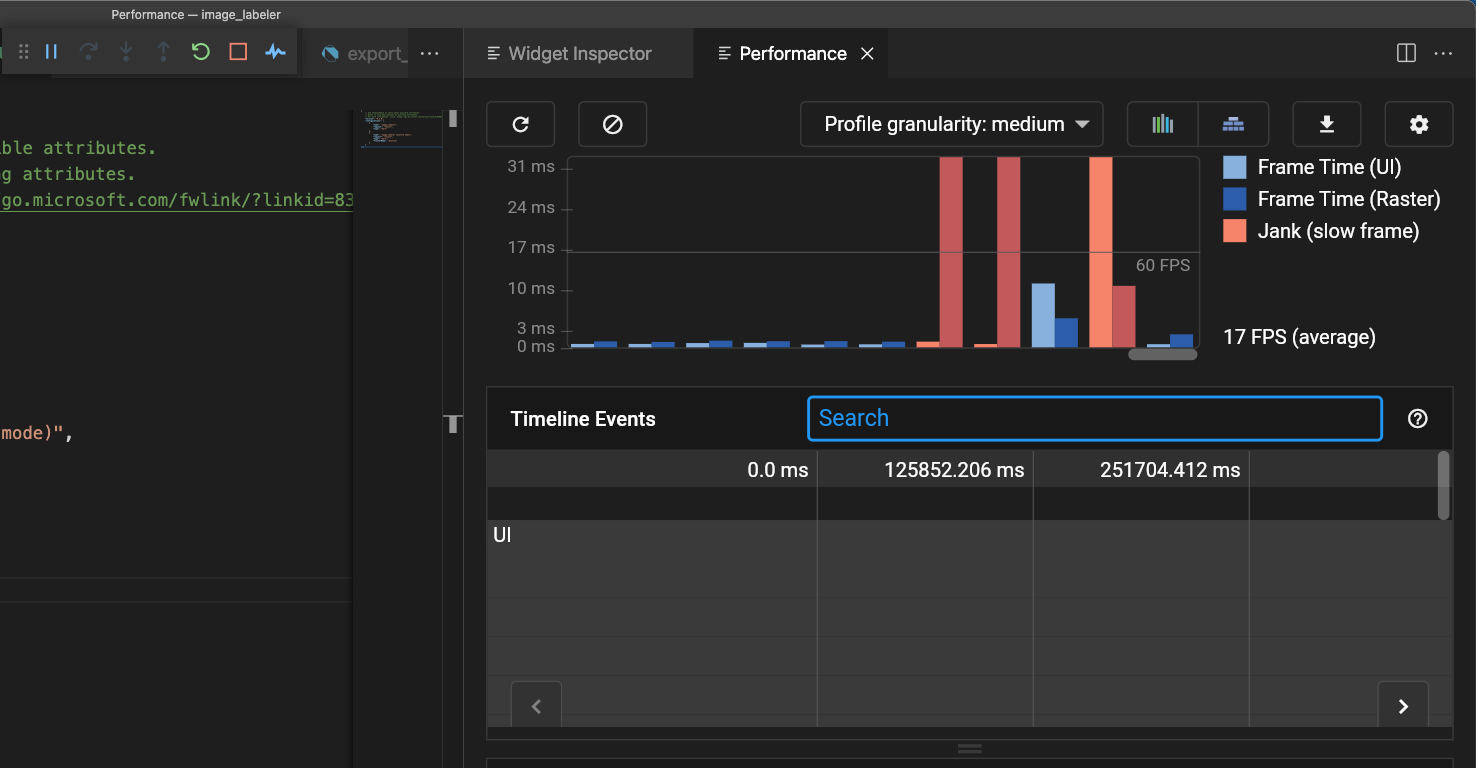
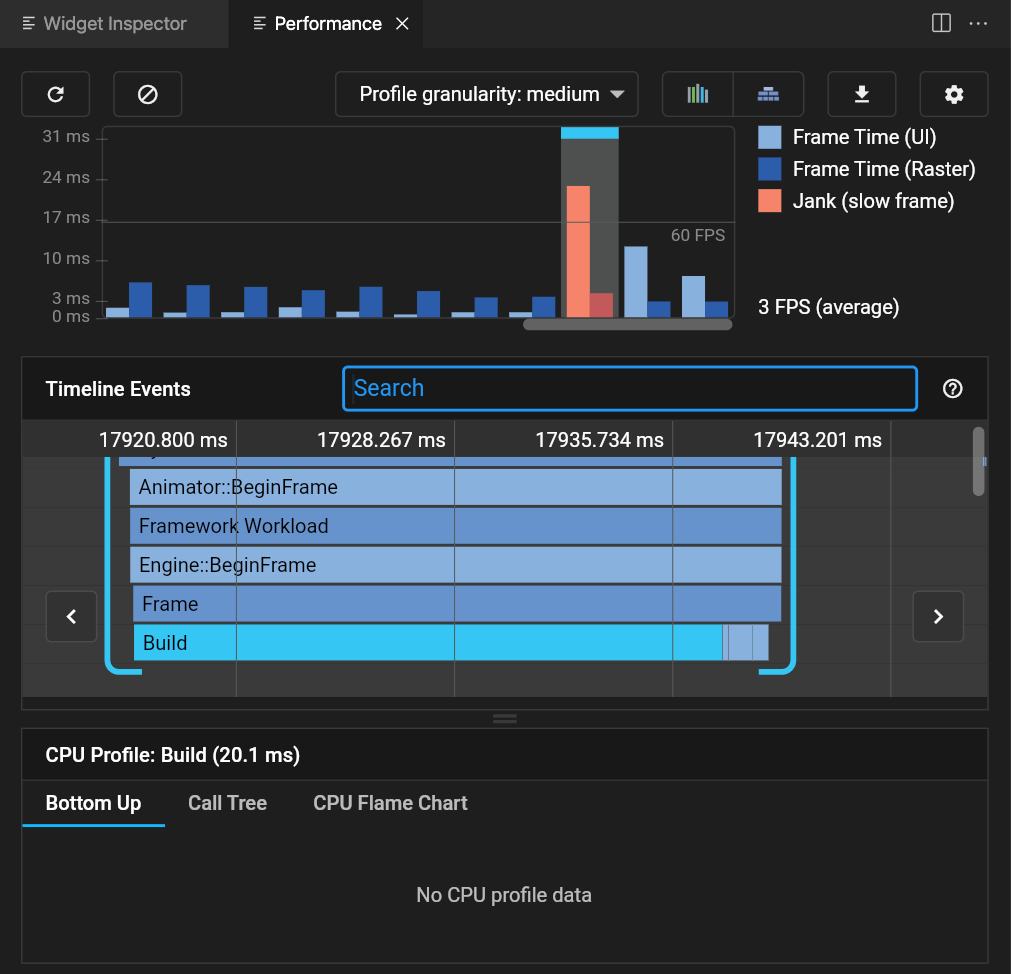
This is still not what I want though since this shows rendering speed, not where CPU time is spent.
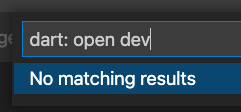
Eventually I found the documentation on how to open the dev tools: https://flutter.dev/docs/development/tools/devtools/vscode.
Then I enabled the CPU recording, tested the app, then came back to the profiler top stop the recording. It showed me a flame graph, which showed me instantly what I was doing wrong.
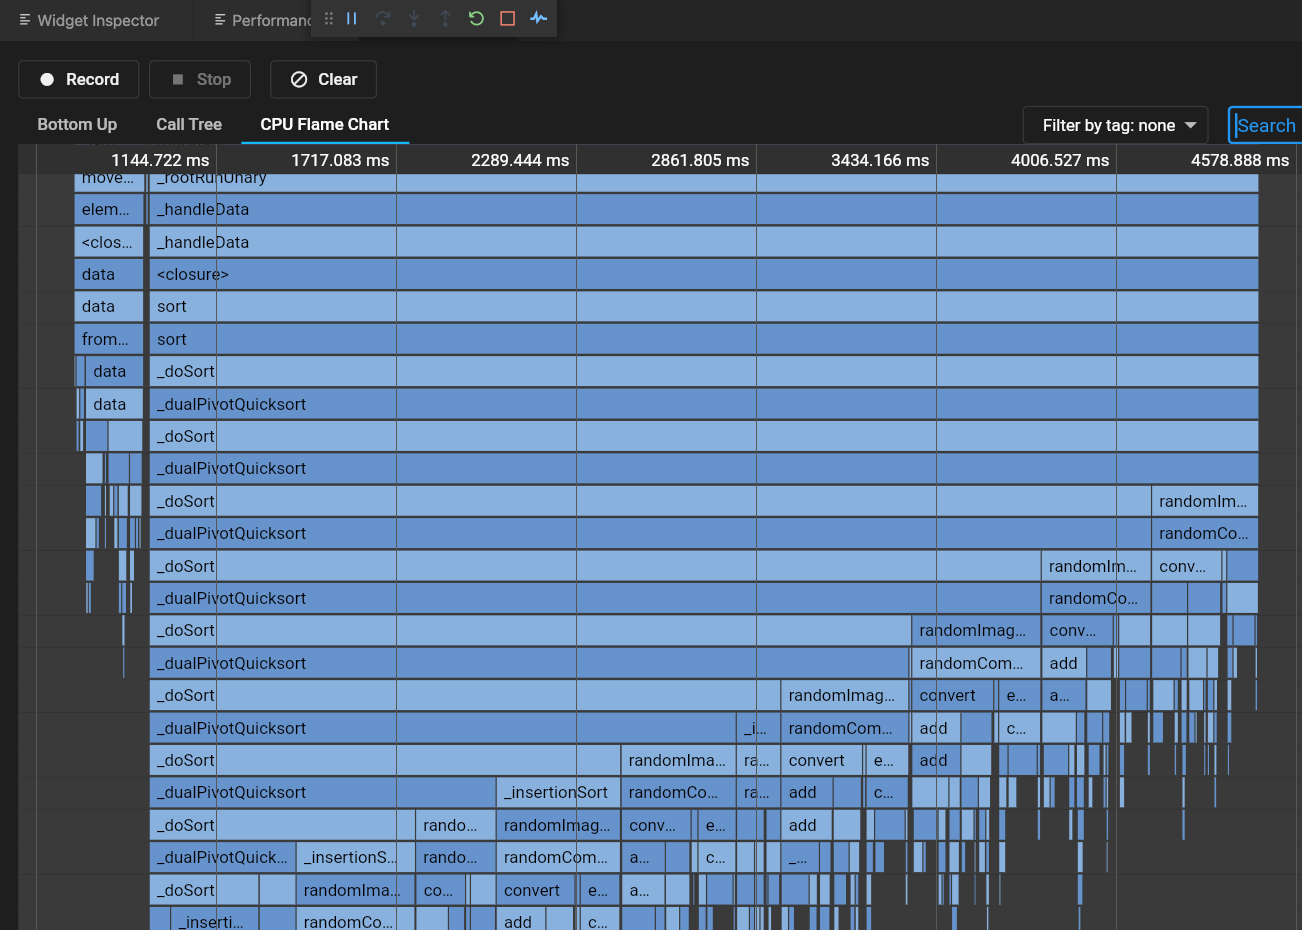
The moral is don't try to sort 17k elements in render(). No matter how fast the machine, it won't be fast enough.